Jul 092013
Example: Robust Fitting
- Create a baseline sinusoidal signal:
xdata = (0:0.1:2*pi)';
y0 = sin(xdata);
- Add noise to the signal with non-constant variance:
% Response-dependent Gaussian noise
gnoise = y0.*randn(size(y0));

% Salt-and-pepper noise
spnoise = zeros(size(y0));
p = randperm(length(y0));
sppoints = p(1:round(length(p)/5));
spnoise(sppoints) = 5*sign(y0(sppoints));

ydata = y0 + gnoise + spnoise;
- Fit the noisy data with a baseline sinusoidal model:
f = fittype('a*sin(b*x)'); fit1 = fit(xdata,ydata,f,'StartPoint',[1 1]); - Identify “outliers” as points at a distance greater than 1.5 standard deviations from the baseline model, and refit the data with the outliers excluded:
fdata = feval(fit1,xdata);
I = abs(fdata - ydata) > 1.5*std(ydata);
outliers = excludedata(xdata,ydata,'indices',I);

fit2 = fit(xdata,ydata,f,'StartPoint',[1 1],'Exclude',outliers);
- Compare the effect of excluding the outliers with the effect of giving them lower bisquare weight in a robust fit:
fit3 = fit(xdata,ydata,f,'StartPoint',[1 1],'Robust','on');
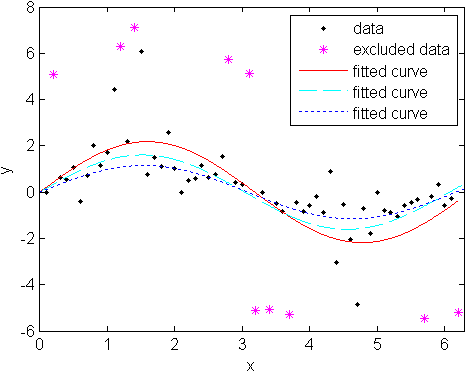
- Plot the data, the outliers, and the results of the fits:
plot(fit1,'r-',xdata,ydata,'k.',outliers,'m*')
hold on
plot(fit2,'c--')
plot(fit3,'b:')
xlim([0 2*pi])

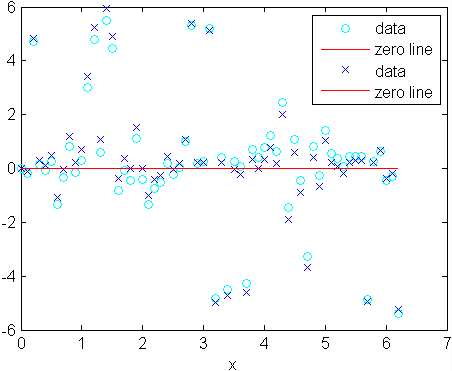
- Plot the residuals for the two fits considering outliers:
figure
plot(fit2,xdata,ydata,'co','residuals')
hold on
plot(fit3,xdata,ydata,'bx','residuals')
